
SunPy Multi-Mission Explorer
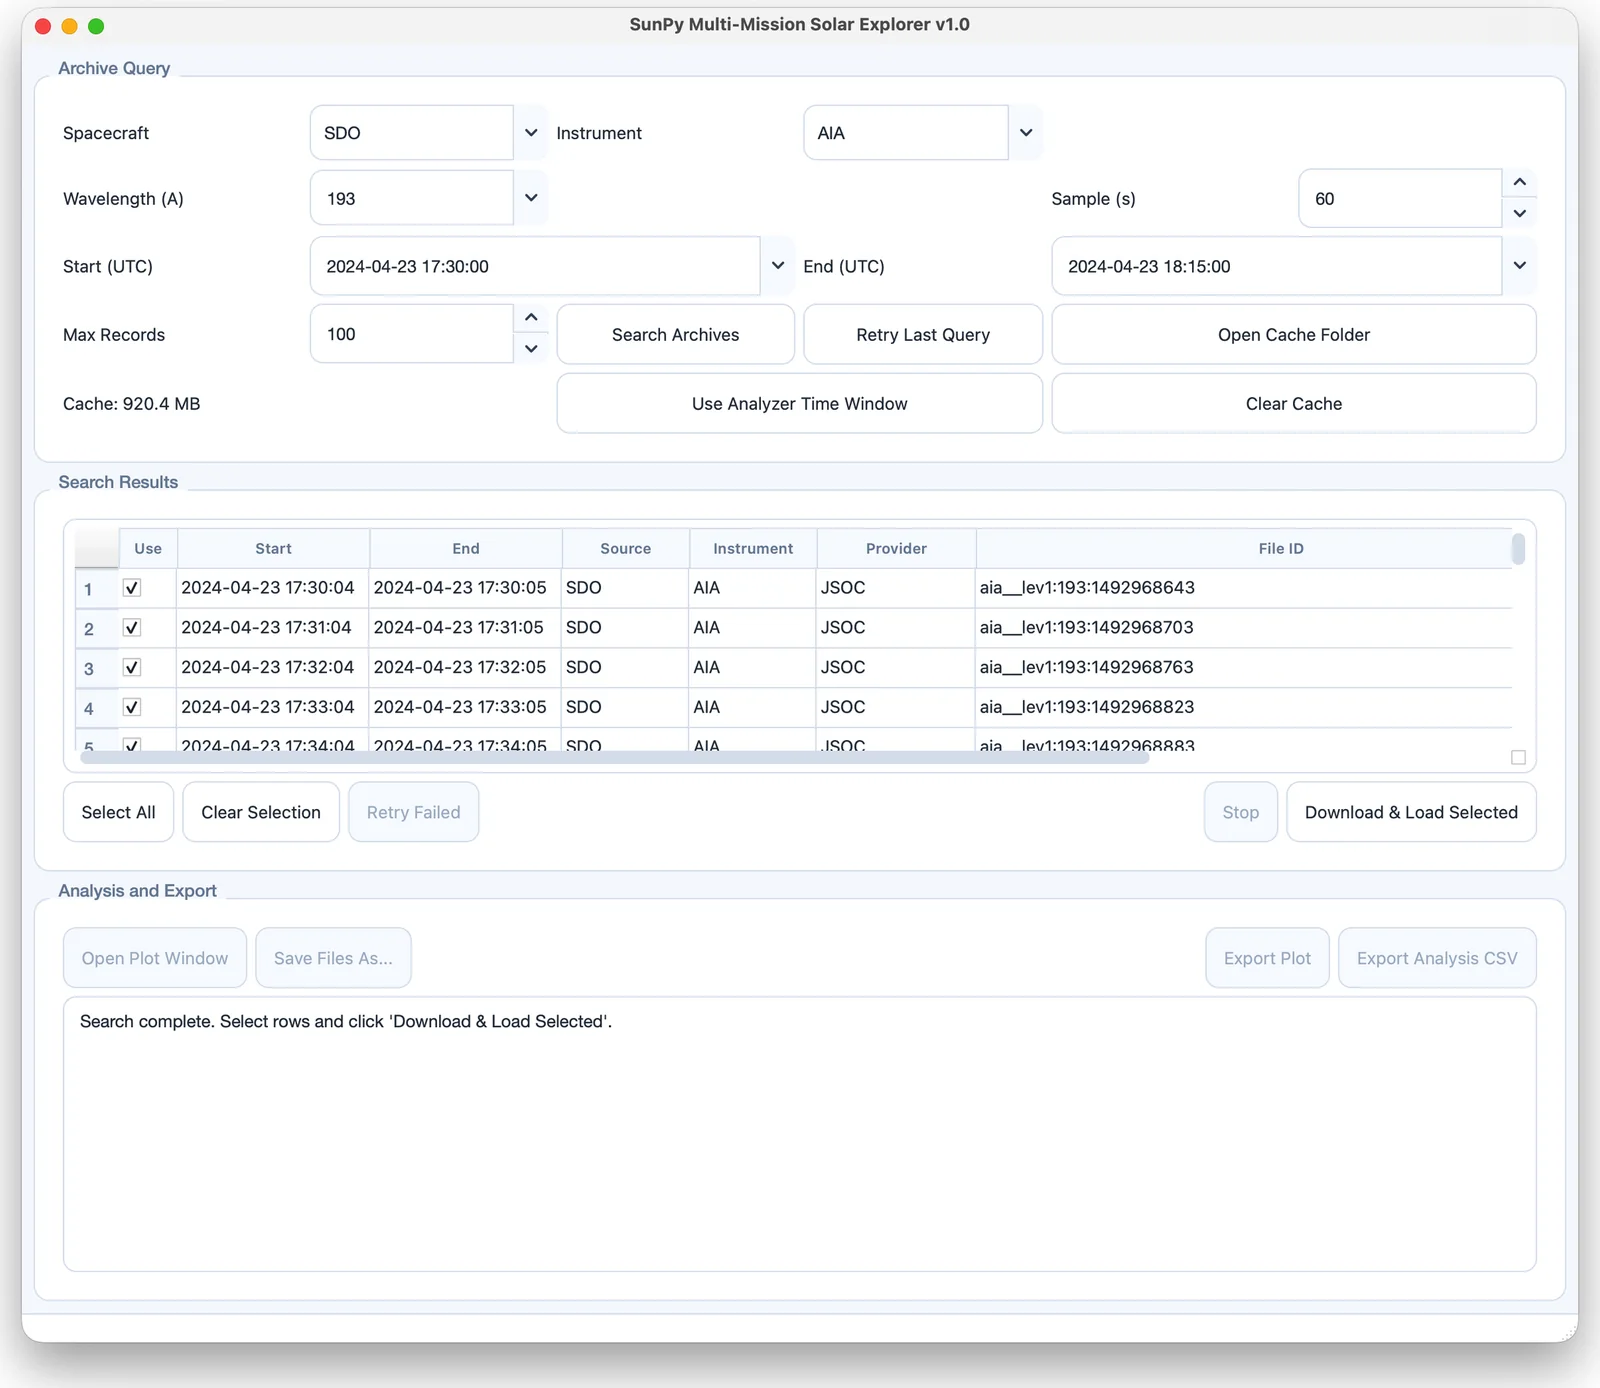
The SunPy Multi-Mission Explorer searches public solar archives through SunPy (The SunPy Community et al. 2020), downloads the selected records into an application-managed cache, and plots images and time series for quick inspection. Open it with Solar Events > Archives > SunPy Multi-Mission Explorer. For in-depth image analysis, use Solar Image Analysis (Part V).
Supported instruments
Table 15.1 lists the instruments that can be searched. Map (image) products are shown in the plot window as image sequences; GOES/XRS is a time series.
| Instrument | Type | Selectable options |
|---|---|---|
| SDO/AIA | Map | Wavelength 94, 131, 171, 193, 211, 304, 335, 1600, 1700 Å |
| SDO/HMI | Map | Product: magnetogram, continuum, dopplergram |
| SOHO/EIT | Map | Wavelength 171, 195, 284, 304 Å |
| SOHO/LASCO C2, C3 | Map | Detector |
| STEREO-A/B SECCHI | Map | Detector EUVI (171, 195, 284, 304 Å), COR1, COR2, HI1, HI2 |
| GOES/SUVI | Map | Wavelength 94, 131, 171, 195, 284, 304 Å; level 1b or 2 |
| PROBA2/SWAP | Map | — |
| GOES/XRS | Time series | GOES satellite |
STEREO-B entries return data only for 2007–2014, before contact with the spacecraft was lost.
Searching the archives
The Archive Query group contains:
- Spacecraft, Instrument
-
the observatory and instrument. The Detector, Wavelength (A), GOES Satellite, product and Level fields appear when they apply to the selected instrument.
- Sample (s)
-
the sampling cadence in seconds; 0 requests the full archive cadence, which is slower and returns more records.
- Start (UTC), End (UTC), Max Records
-
the time range and the maximum number of records returned.
- Search Archives
-
runs the query. Retry Last Query repeats it, for example after a network error.
- Use Analyzer Time Window
-
sets the time range from the spectrum in the main window and searches.
- Open Cache Folder, Clear Cache
-
manage the download cache; its size is shown.
The Search Results table lists, for each record, the start and end time, source, instrument, provider, file identifier and size. Tick the records to download with the Use column or Select All and Clear Selection, then click Download & Load Selected. Retry Failed downloads again only the rows that failed, and Stop cancels a running search or download. Cached files can be reopened without a network connection.
The plot window
Open Plot Window in the Analysis and Export group opens the SunPy Plot and Animation window with the loaded data (Figure 15.2).
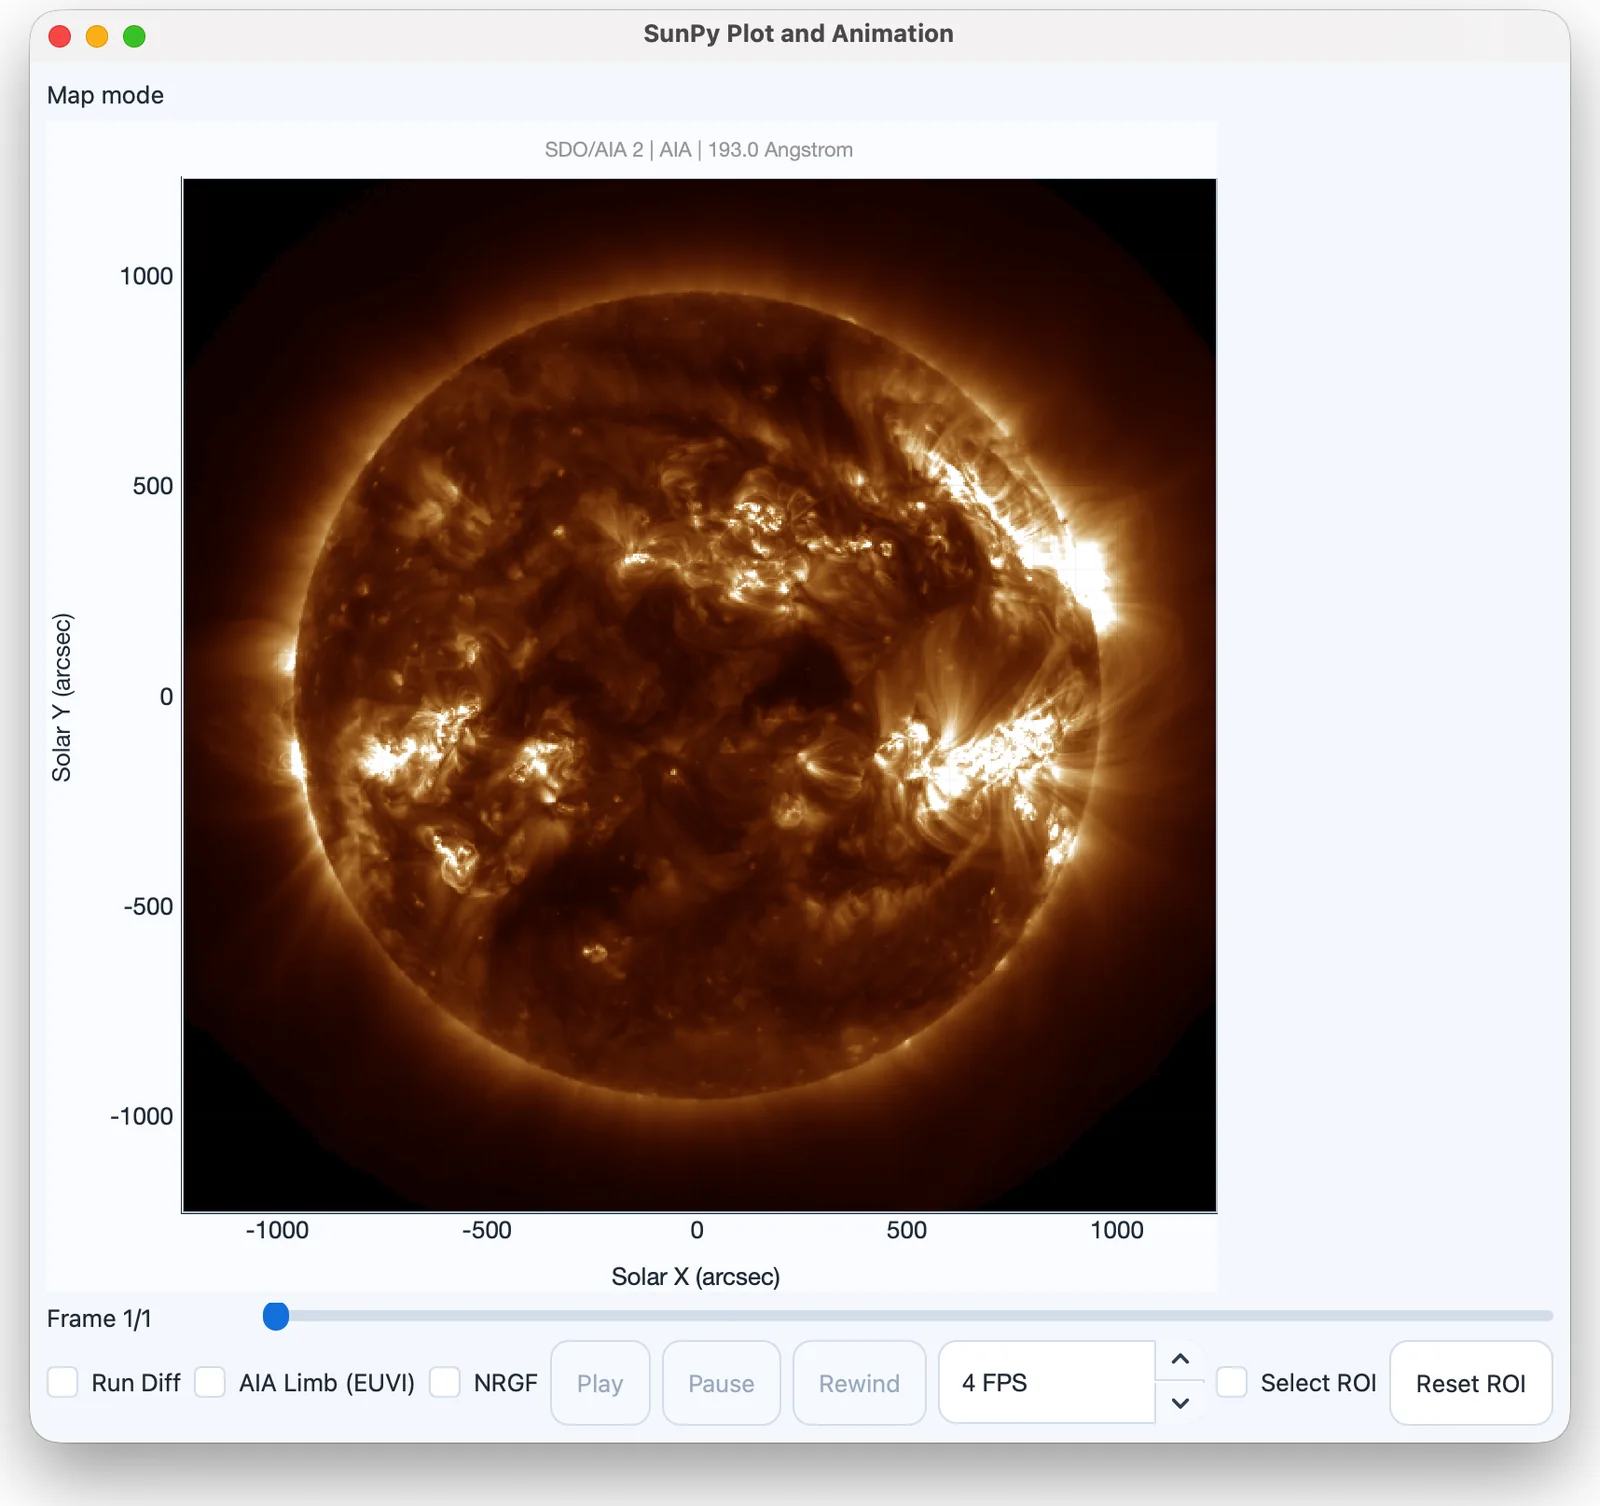
In map mode the controls are:
- Frame slider
-
steps through the sequence; the frame number is shown.
- Run Diff
-
shows running differences between consecutive frames. Difference > Base Difference shows each frame minus the first.
- AIA Limb (EUVI)
-
on STEREO/EUVI images, draws the solar limb as seen from Earth, showing which part of the disk is visible to SDO/AIA.
- NRGF
-
applies the normalizing-radial-graded filter (Morgan et al. 2006) to coronagraph images (COR1, COR2, LASCO), flattening the radial fall-off of brightness to reveal faint CME fronts.
- Play, Pause, Rewind, FPS
-
animate the sequence at 1–30 frames per second.
- Select ROI, Reset ROI
-
draw a rectangular region of interest on the map, for which the minimum, maximum, mean, median, standard deviation and 95th and 99th percentiles are computed.
In time-series mode (GOES/XRS) the window plots the X-ray channels and derives basic flare summary metrics.
Exporting
The Analysis and Export group of the explorer provides Save Files As..., which copies the downloaded data files to a folder of your choice; Export Plot, which saves the current plot as PNG, PDF, SVG, TIFF or JPG; and Export Analysis CSV, which saves the ROI statistics or flare summary.