
Solar-Event Viewers
The viewers in the Solar Events menu place a radio event in its wider context: the X-ray flare, energetic protons, the geomagnetic response and any associated coronal mass ejection. Each viewer is an independent window that fetches its data from the archive listed in Appendix C. The viewers can also be started from source as standalone programs (Section 2.5).
Common controls
The GOES and geomagnetic viewers share a common layout:
a time-range selector with Start and End rows (date, and hour, minute or three-hour slot) and, where applicable, the spacecraft;
a Preset list with Apply for common ranges;
a plot button that fetches and plots the data, with a progress indicator;
Save Plot (PNG) and Save Data (CSV);
a reset or clear button; and
an information panel summarizing the plotted data or a selected interval.
Synchronizing the time window
Solar Events > Sync Current Time Window sends the time range of the spectrum loaded in the main window to every open context window: the GOES X-ray and proton viewers, the Dst and Kp viewers and the STEREO/SWAVES dialog plot the new range; the SOHO/LASCO CME catalog searches the day of the middle of the range; and the SunPy Explorer takes the range as its query window. The status bar reports which windows were updated, or that none were open.
GOES X-ray flux
Solar Events > Flares > GOES X-Ray Flux opens the GOES XRS Plotter (Figure 14.1), which plots the soft X-ray flux measured by the GOES X-Ray Sensor in its short (XRS-A, 0.05–0.4 nm) and long (XRS-B, 0.1–0.8 nm) channels.
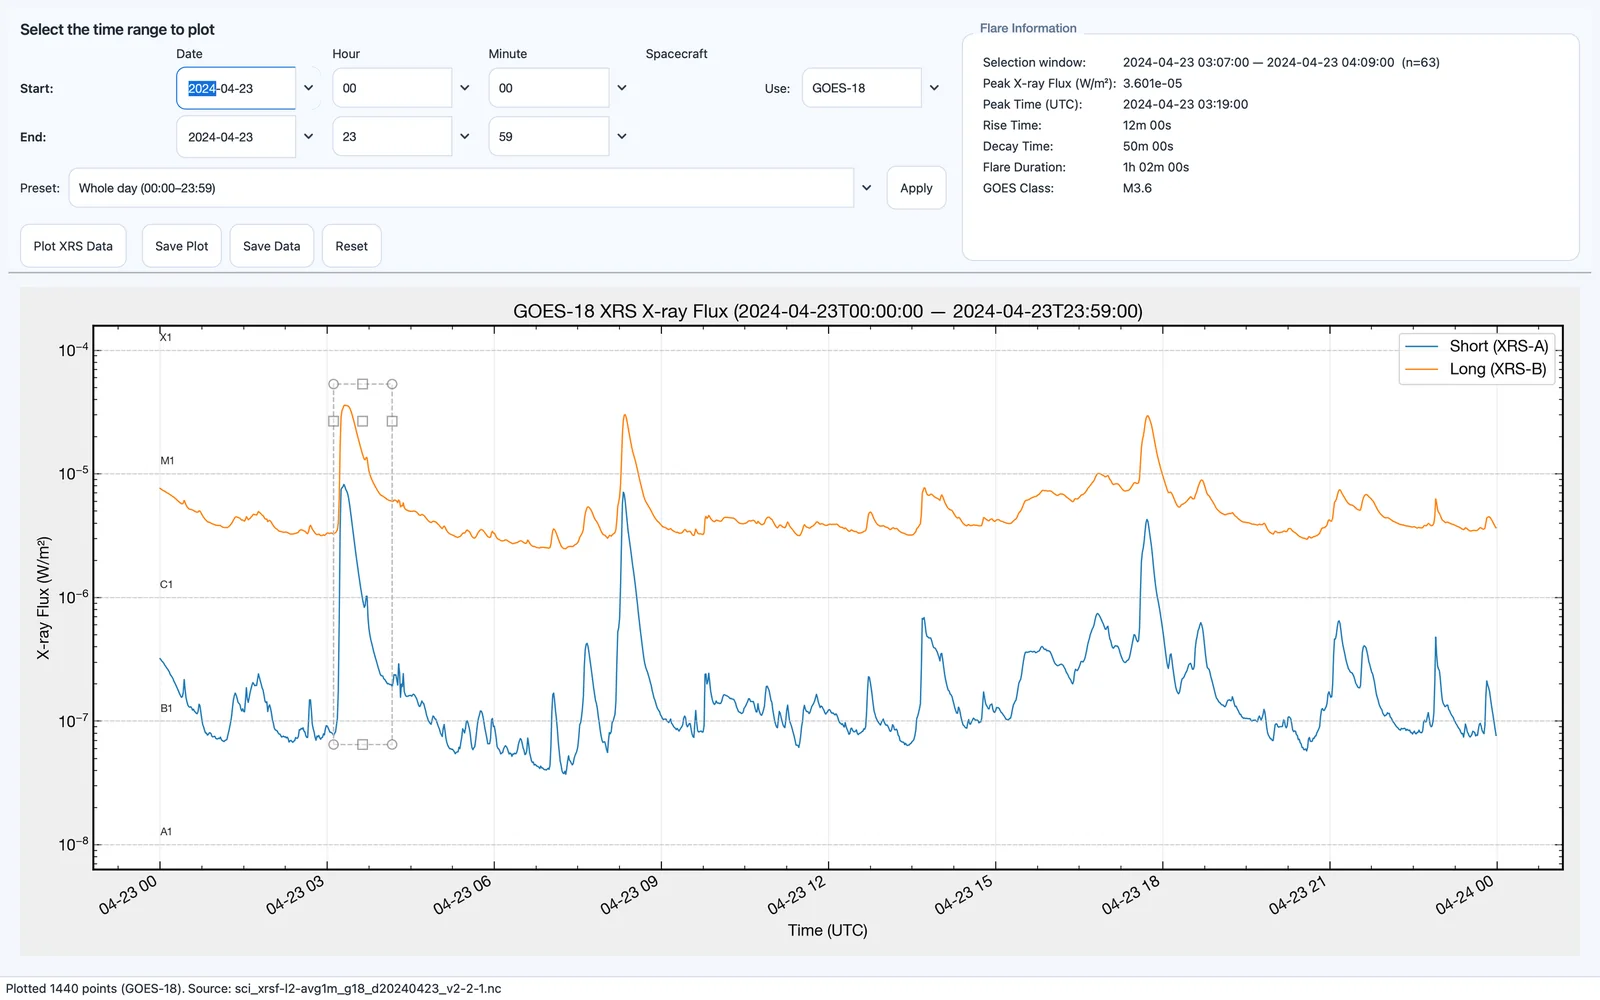
- Start, End, Use
-
the UTC range and the spacecraft (GOES-8 to GOES-19; default GOES-16). Preset: Whole day (00:00–23:59) selects the whole of the start day.
- Plot XRS Data
-
downloads the daily science files from NOAA and plots both channels on a logarithmic flux axis.
- Selection
-
drag across the plot to select a flare interval. The Flare Information panel then shows the Selection window, the Peak X-ray Flux (W/m²) and Peak Time (UTC) of the long channel, the Rise Time (selection start to peak), the Decay Time (peak to selection end), the Flare Duration and the GOES Class derived from the peak flux.
- Save Plot, Save Data, Reset
-
save the figure as PNG, save the fluxes as CSV, or clear the plot and selection.
GOES overlay on the spectrum
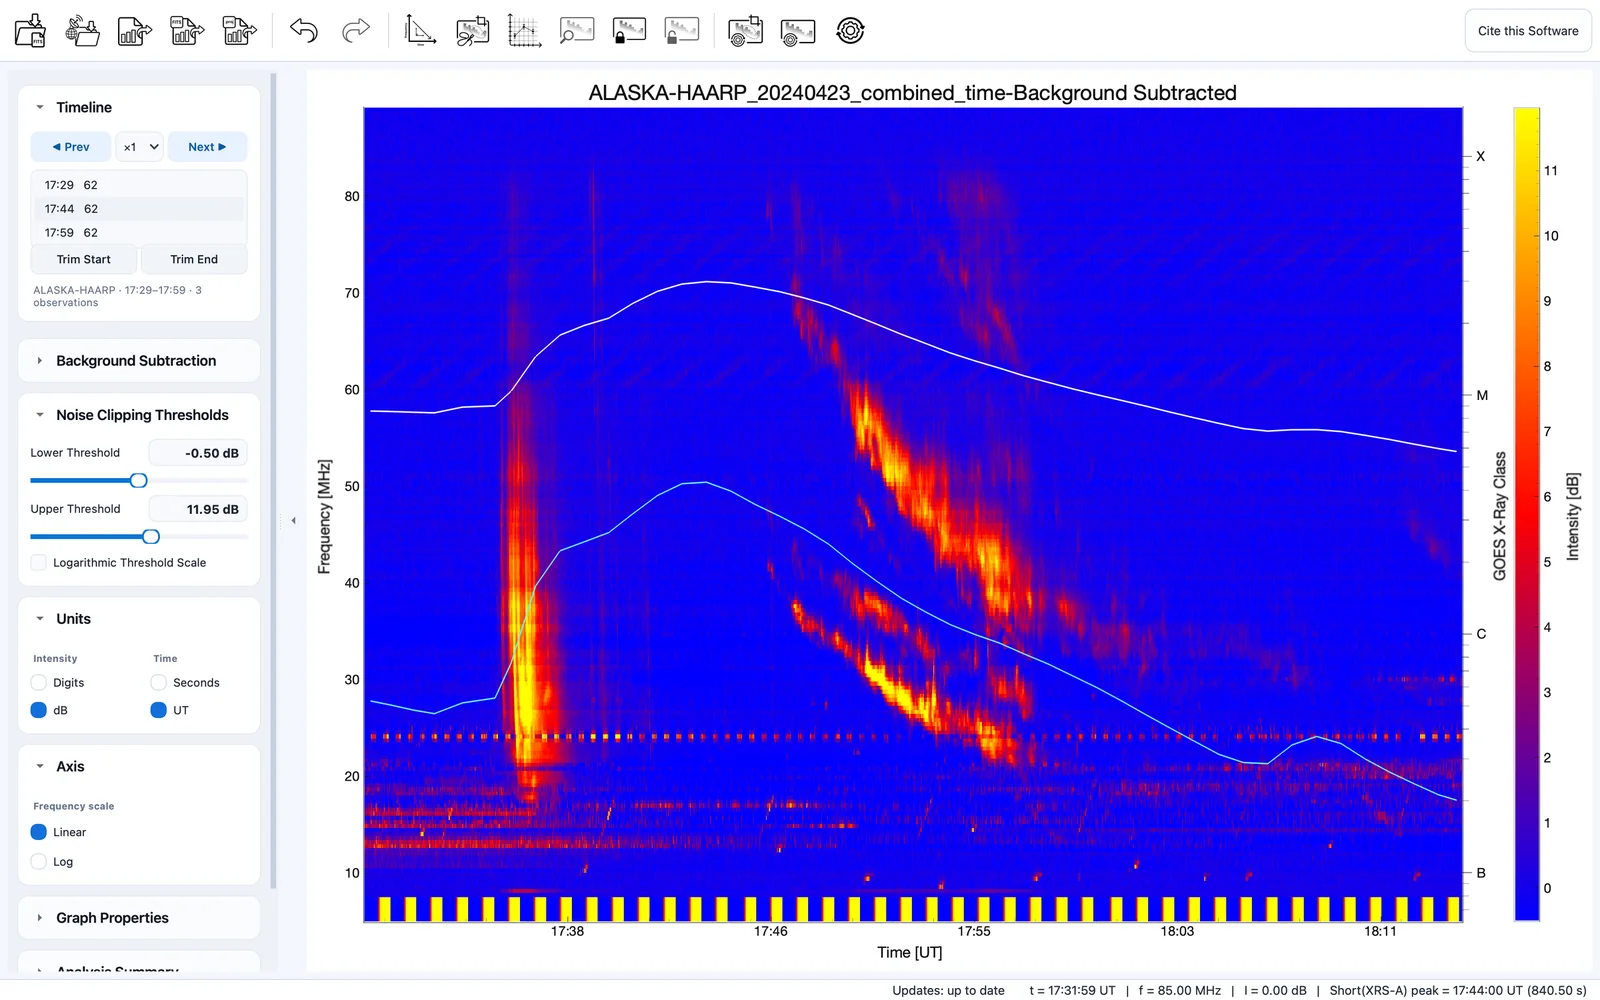
Solar Events > GOES Overlay > Short(XRS-A) and Long(XRS-B) draw the GOES X-ray curves directly on the dynamic spectrum in the main window (Figure 14.2), with a flare-class guide (A, B, C, M, X) on the right. The overlay does not modify the spectrum data. The application chooses a GOES satellite appropriate for the date automatically, falling back across legacy and modern satellites when a file is unavailable. The overlay is included in exported figures.
GOES proton flux
Solar Events > Energetic Particles > GOES SEP Proton Flux opens the GOES SEP Proton Flux Plotter (Figure 14.3), which plots proton fluxes from the GOES Solar and Galactic Proton Sensor (SGPS) archive at NOAA over multi-day UTC ranges.
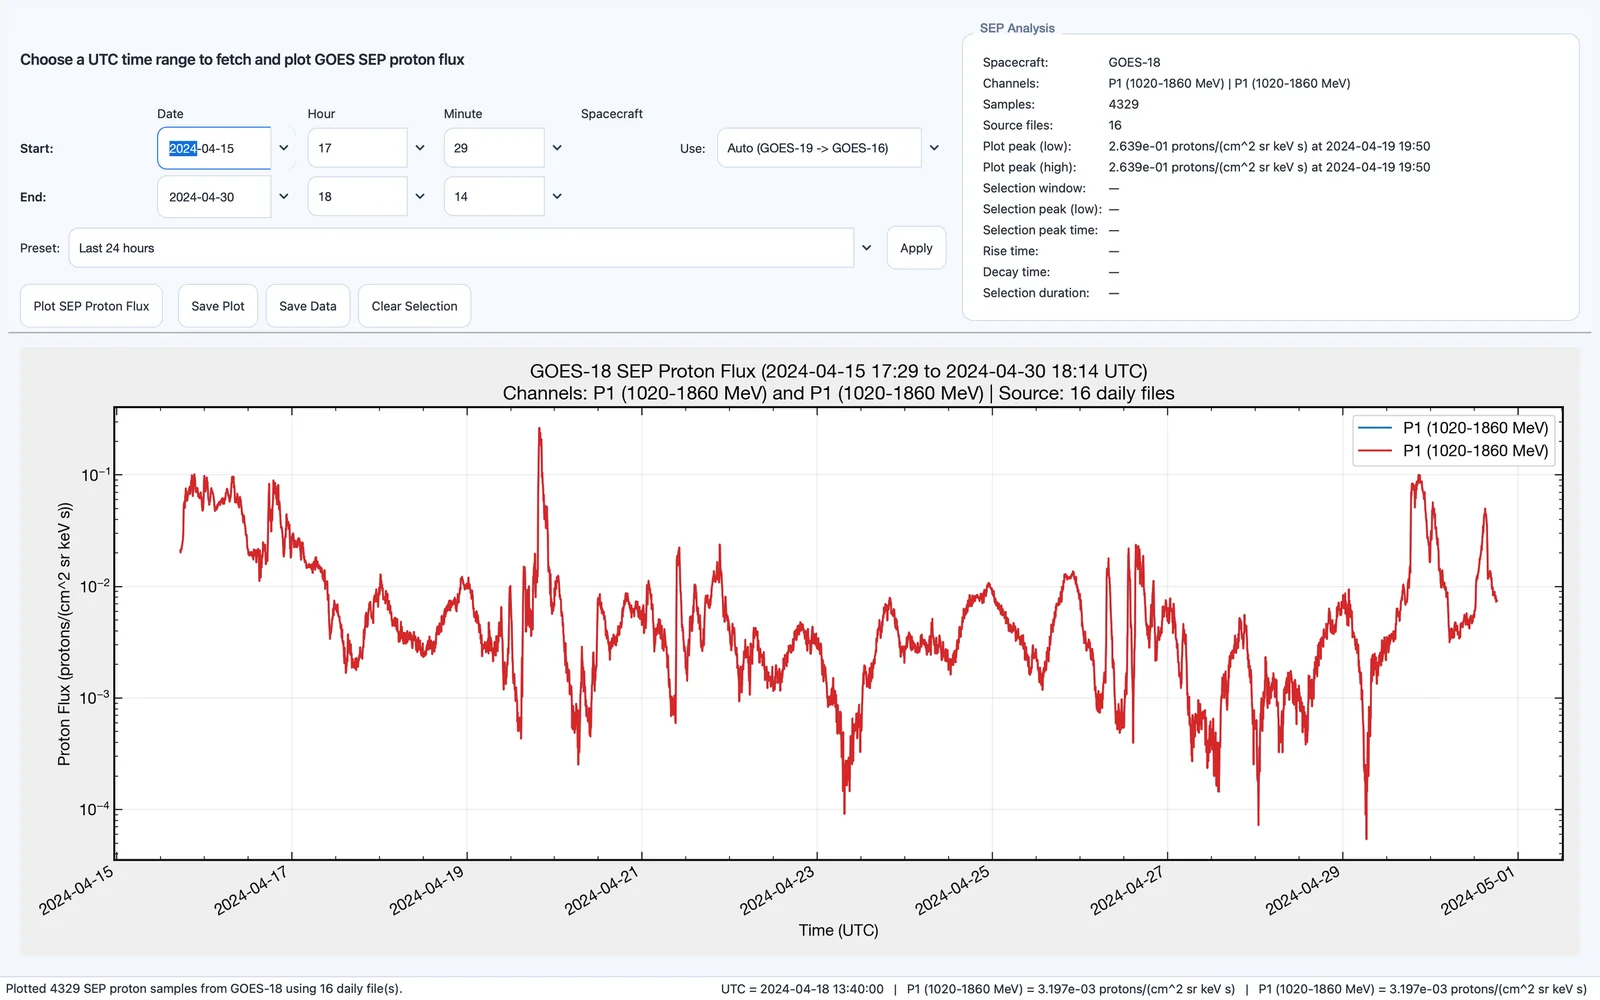
- Start, End, Use
-
the UTC range and the spacecraft: Auto (GOES-19 -> GOES-16) tries the newest spacecraft first, or a specific GOES satellite can be chosen.
- Preset
-
Last 24 hours, Last 72 hours, Last 7 days or Current UTC day.
- Plot SEP Proton Flux
-
fetches and stitches the daily files and plots the channels closest to about 10 MeV and 100 MeV, with hover readouts.
- Selection
-
drag across the plot to measure an event.
- SEP Analysis
-
the spacecraft, channels, number of samples and source files, the peaks of both channels in the plot, and for the selection its window, peak (low channel), peak time, rise time, decay time and duration.
- Save Plot, Save Data, Clear Selection
-
save the figure as PNG, save the stitched flux table as CSV, or clear the selection.
Kyoto Dst index
Solar Events > Geomagnetic > Kyoto Dst Index opens the Dst Index viewer (Figure 14.4) for the hourly Dst index from the World Data Center for Geomagnetism, Kyoto (Nosé et al. 2015). Dst measures the strength of the ring current; large negative values indicate geomagnetic storms.
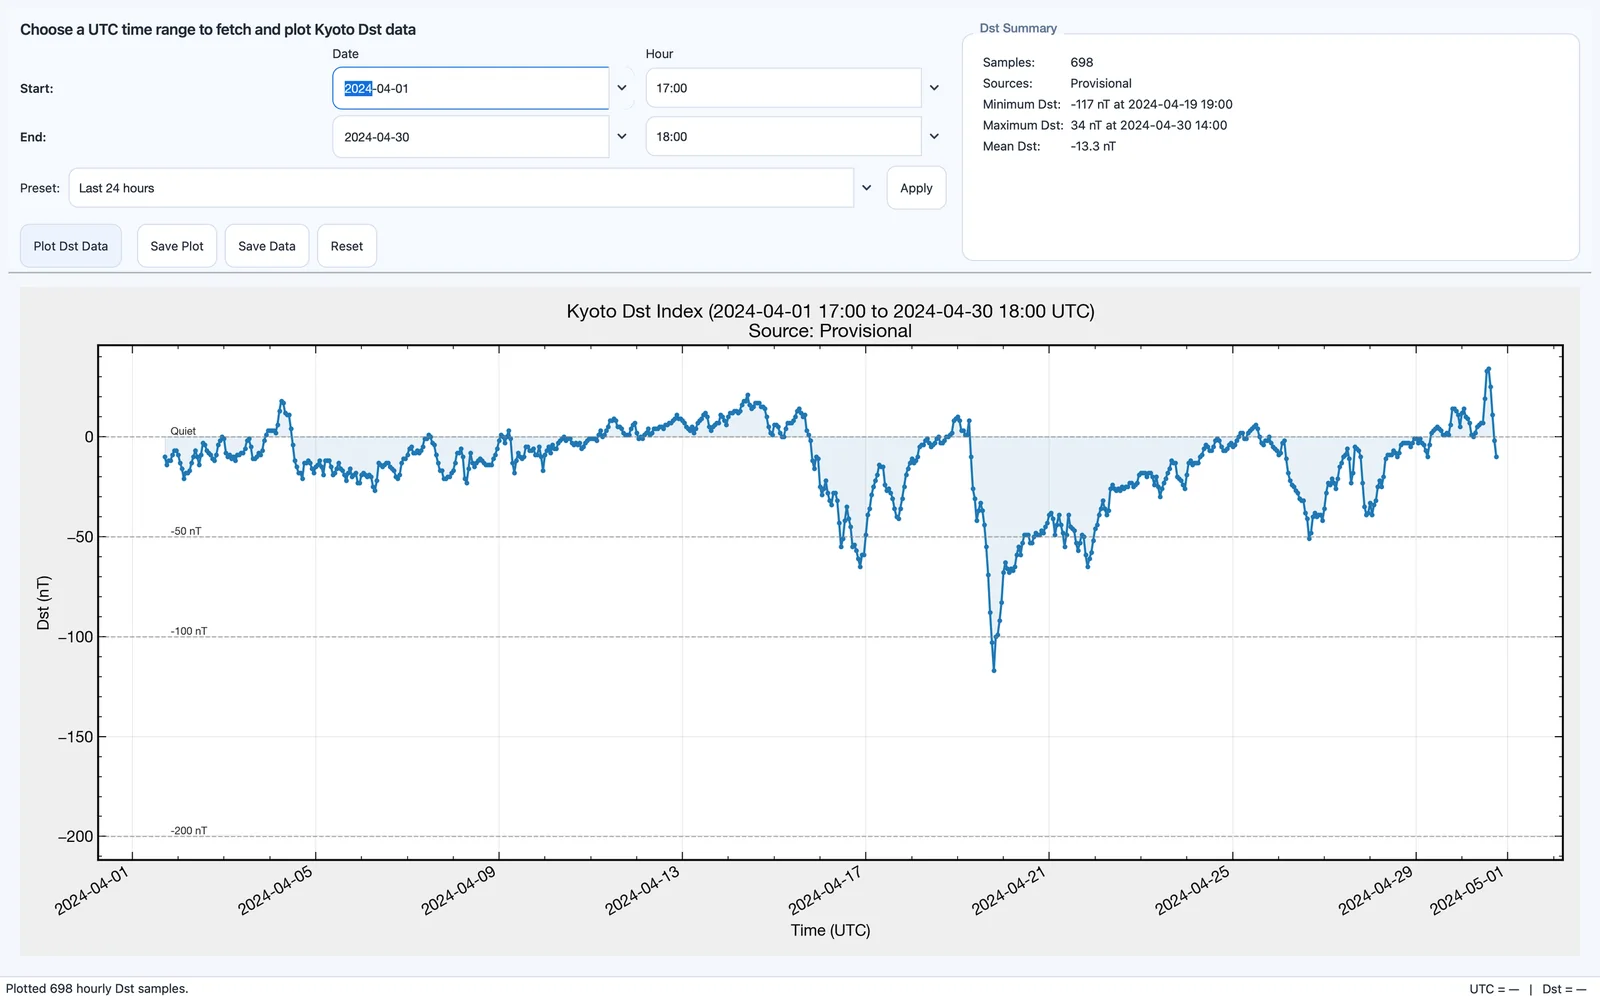
- Start, End
-
date and hour. Preset: Last 24 hours, Last 7 days, Current month or Previous month.
- Plot Dst Data
-
fetches and plots the index with storm-level guides at 0 (quiet), , and nT.
- Dst Summary
-
the number of samples, the data sources (final, provisional or real-time), and the minimum, maximum (each with its time) and mean Dst.
- Save Plot, Save Data, Reset
-
PNG figure, CSV table, or clear.
GFZ Kp index
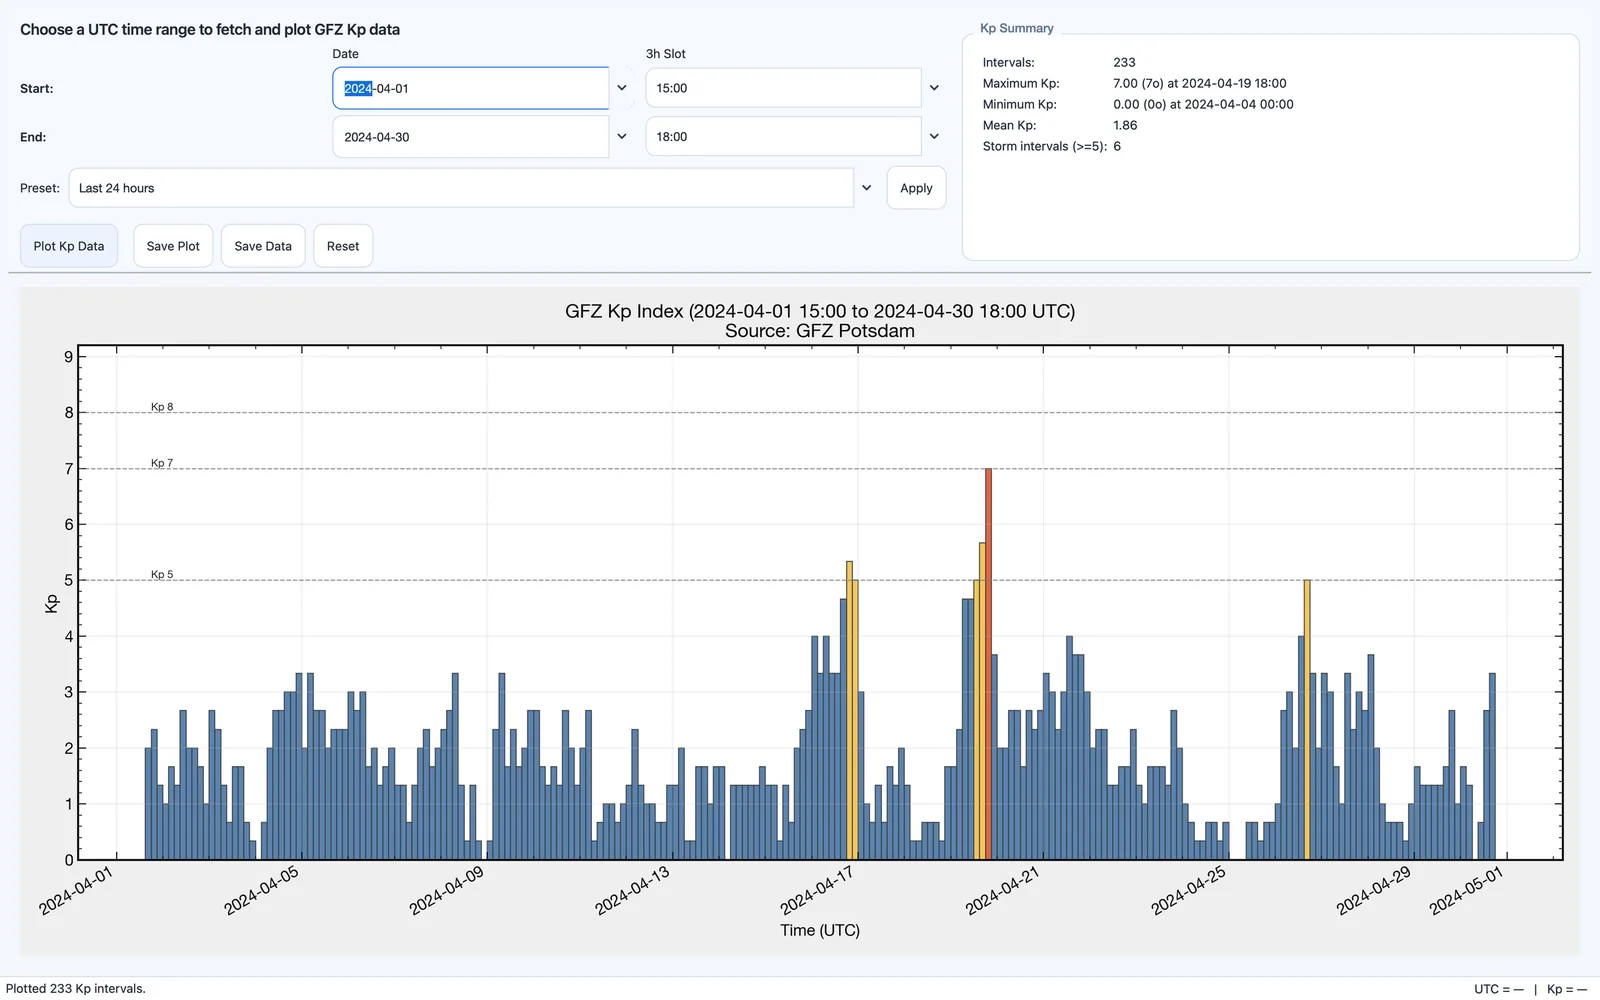
Solar Events > Geomagnetic > GFZ Kp Index opens the Kp Index viewer (Figure 14.5) for the three-hourly planetary Kp index from GFZ Potsdam (Matzka et al. 2021).
- Start, End
-
date and three-hour slot (3h Slot). Preset: Last 24 hours, Last 7 days, Current month or Previous month.
- Plot Kp Data
-
plots the index as bars colored by activity (quiet below 5, storm from 5, severe from 7), with guide lines at Kp 5, 7 and 8.
- Kp Summary
-
the number of intervals, the maximum, minimum and mean Kp, and the number of storm intervals ().
- Save Plot, Save Data, Reset
-
PNG figure, CSV table, or clear.
SOHO/LASCO CME catalog
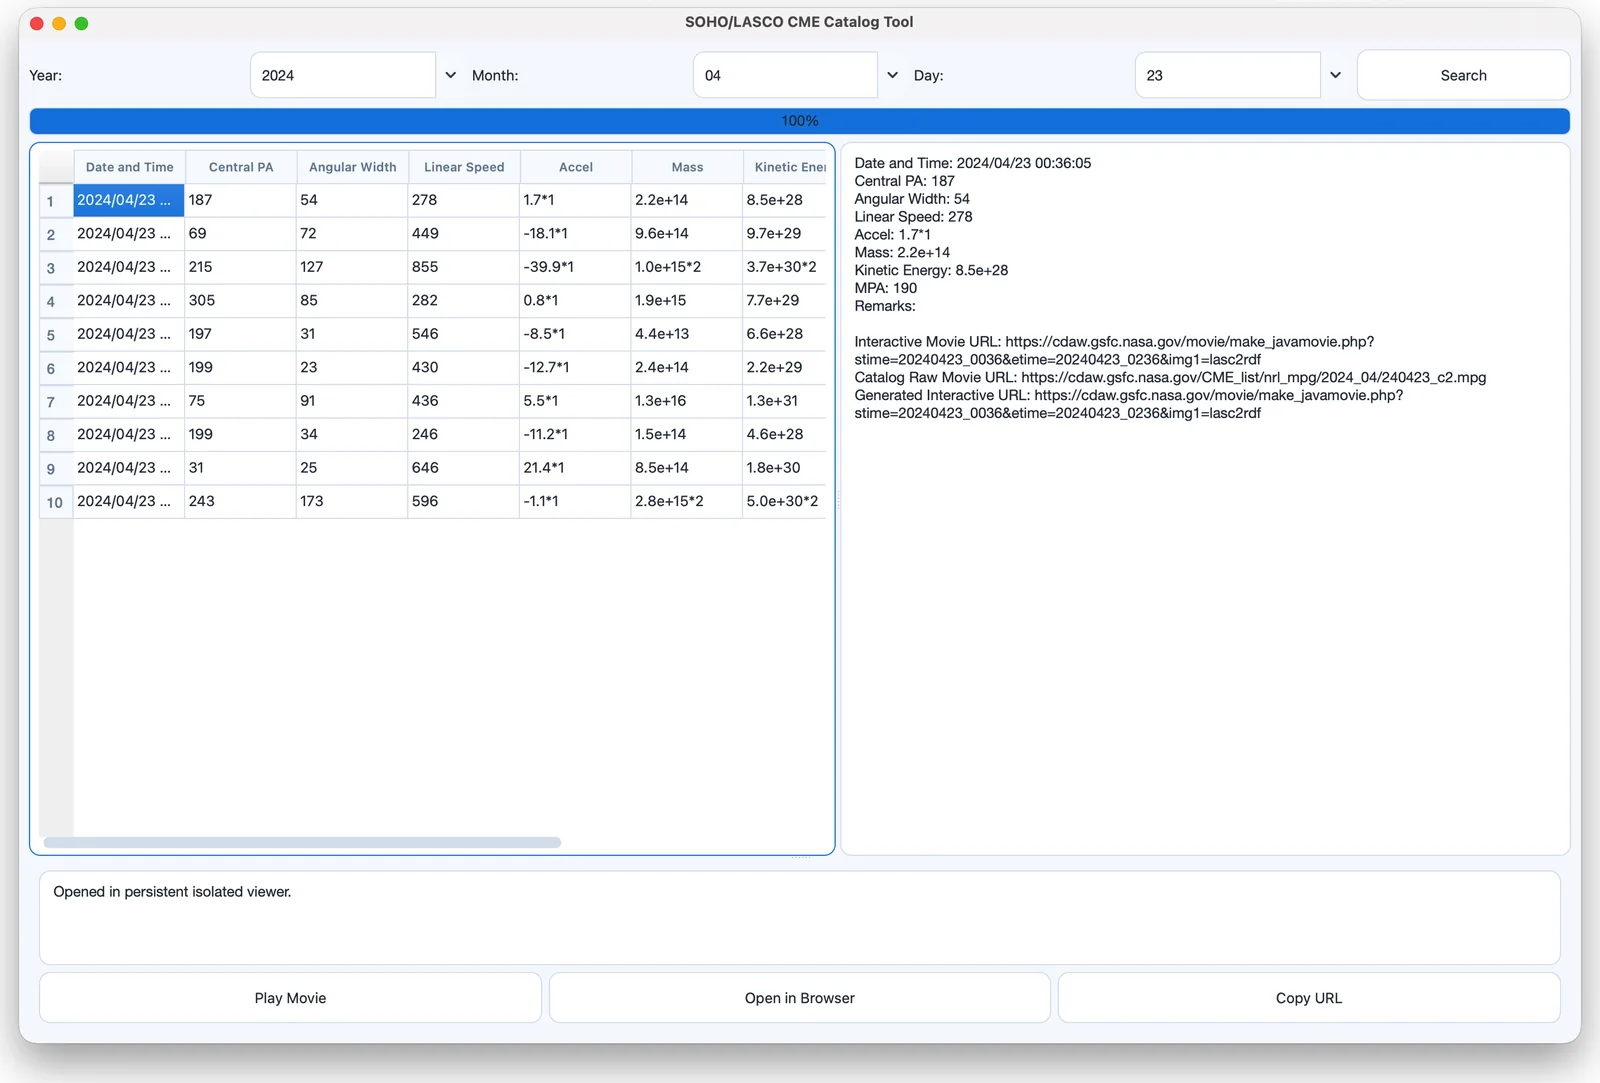
Solar Events > CMEs > SOHO/LASCO CME Catalog opens the SOHO/LASCO CME Catalog Tool (Figure 14.6), which reads the CDAW catalog of CMEs observed by SOHO/LASCO (Yashiro et al. 2004).
- Year, Month, Day, Search
-
list the CMEs of the chosen day. A progress bar shows the retrieval.
- CME table
-
one row per CME with the columns Date and Time, Central PA, Angular Width, Linear Speed, Accel, Mass, Kinetic Energy, MPA (measurement position angle) and Remarks. Clicking a row shows its details beside the table.
- Play Movie
-
plays the LASCO movie associated with the selected CME (double-clicking a row does the same) in a viewer with Back, Forward, Reload, Open in Browser, Open Raw Movie and Copy URL.
- Open in Browser, Copy URL
-
open the CDAW page of the selected CME, or copy its address.