Multi-Station Comparison
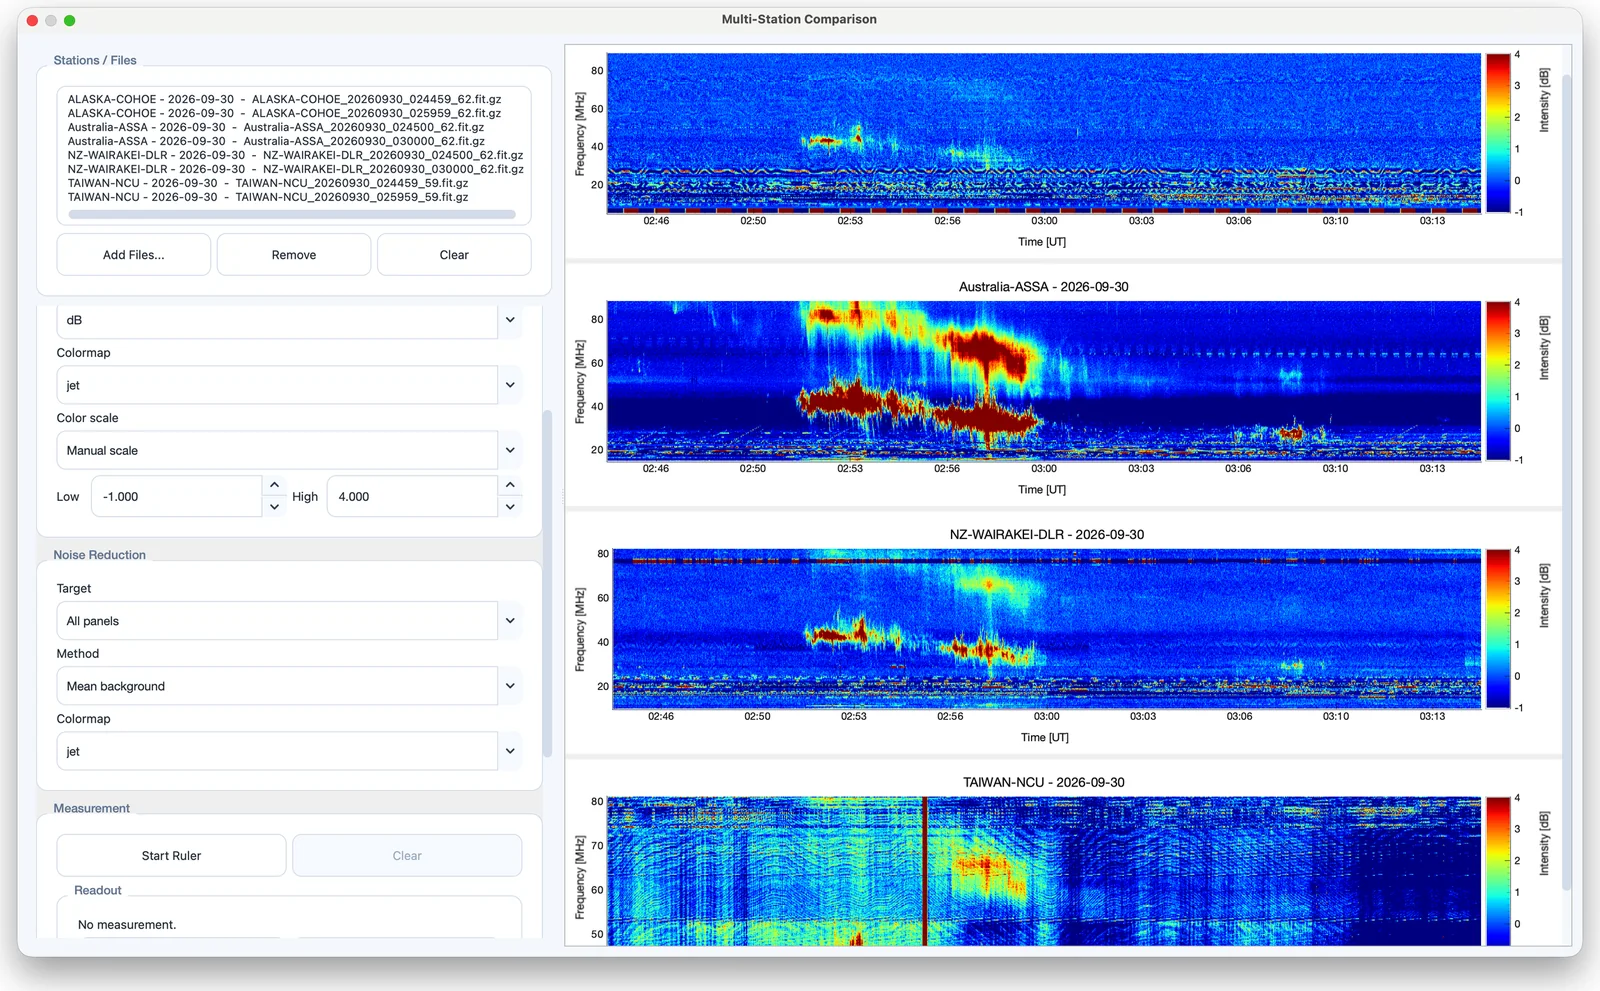
The Multi-Station Comparison workspace displays dynamic spectra from several stations in vertically stacked panels with a shared time axis, so that the same event can be compared across stations, receivers and frequency ranges (Figure 12.1). It is opened from View > Multi-Station Comparison... or with the Compare button of the downloader (Chapter 11).
The workspace follows the rendering mode of the application: in Modern mode the panels are hardware-accelerated when available, and in Classic mode they are drawn with Matplotlib.
Stations and files
The Stations / Files group lists the loaded files as station – date – file name. Add Files... adds FITS files from disk, Remove removes the selected entry and Clear removes all entries. Files that can be combined are merged automatically before display: each station’s files are combined in time, in frequency, or as a complete time focus-code grid (Section 5.3), so a mixed-station selection yields one panel per station. Hovering over an entry shows any warning raised while reading it.
Display controls
| Group | Control | Function |
|---|---|---|
| View | Time alignment | UT clock aligns the
panels on Universal Time; Seconds from file start
aligns each panel on its own start. UT alignment requires
TIME-OBS in every file; otherwise the workspace switches to
seconds and says so. |
| Appearance | Units | Digits or dB. |
| Colormap | Color map of all panels. | |
| Color scale | Shared scale (one scale for all panels), Per-station auto scale, or Manual scale with Low and High limits. | |
| Noise Reduction | Target | All panels or one panel. |
| Method | None, Mean background, Median background, Robust background or Noise clipping. | |
| Colormap | Color map of the noise-reduced panels. | |
| Thresholds | With Noise clipping, Lower threshold and Upper threshold sliders and a Logarithmic Threshold Scale option, as in the main window. |
Display range and view configurations
The Actions group contains:
- Set Range...
-
enter a shared time and frequency range for all panels.
- Reset Range
-
return to the full range of the data.
- Load View Config...
-
apply a
.efaview.jsonview configuration (Section 7.2.2). The visual settings are applied; when the files differ in date, set UT bounds with Set Range.... - Export...
-
export the comparison (Section 12.5).
Ruler measurement
In the Measurement group, Start Ruler activates a ruler: click two points in one panel to measure the duration, frequency drift and slope, shown under Readout. Clear removes the measurement.
Exporting a comparison
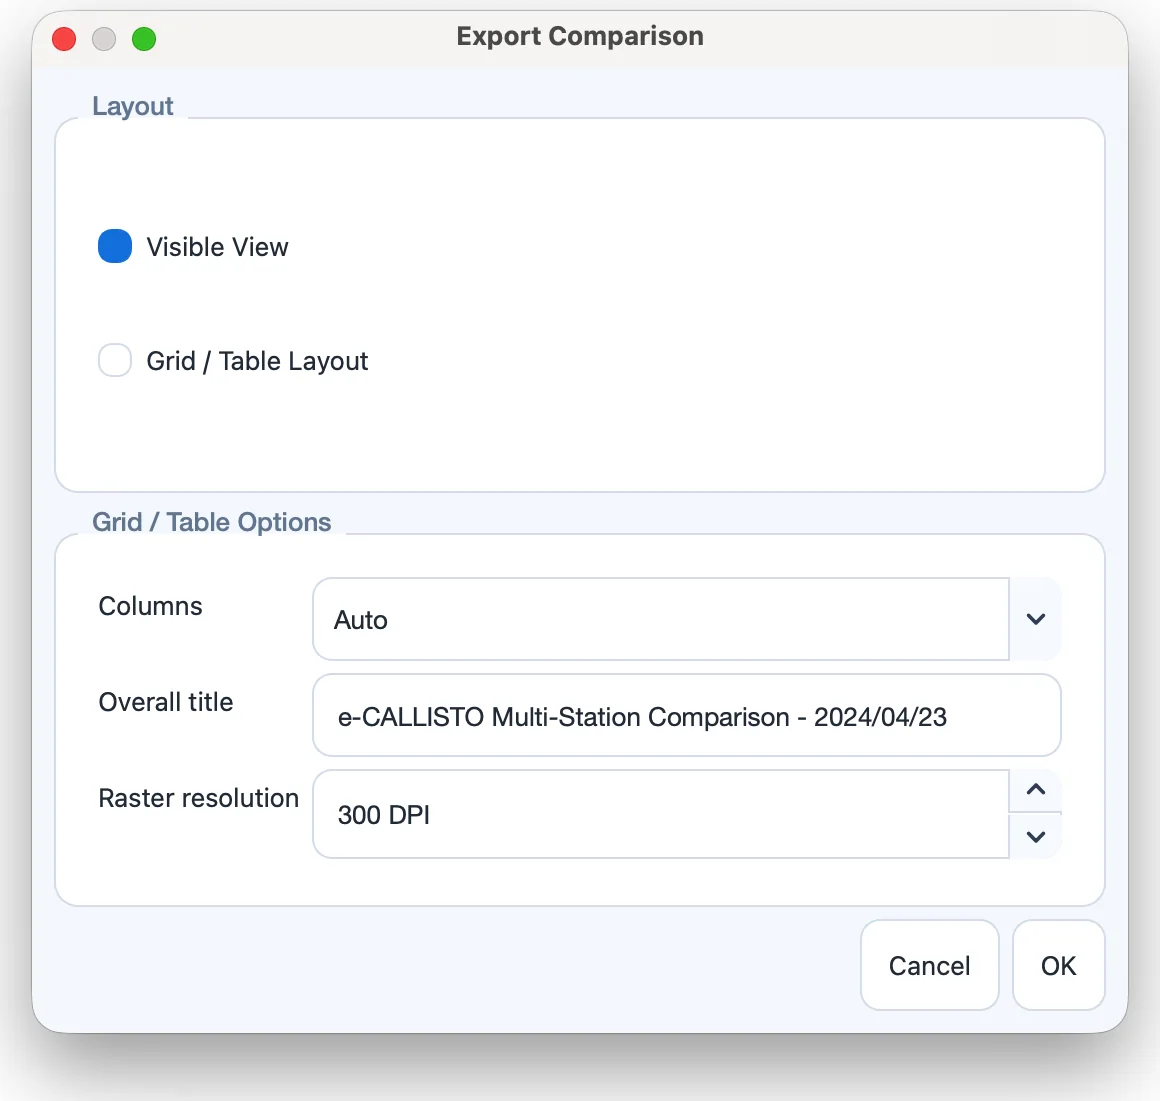
Export... opens the Export Comparison dialog (Figure 12.2):
- Visible View
-
exports the comparison exactly as it appears in the window.
- Grid / Table Layout
-
exports a compact publication-style matrix of all panels, with a shared time axis, each station’s native frequency range and a white background. Its options are the number of Columns (Auto or a fixed number), an Overall title, and the Raster resolution (DPI) for bitmap formats.
The figure can be saved as PNG, PDF, EPS, SVG or TIFF.