
Projects, Reports and Export
This chapter describes how the state of an analysis is saved and recovered, and how figures, processed data, reports and batches of files are exported.
Projects
A project file (.efaproj) stores the complete state of
the analyzer so that work can be resumed exactly where it was left. A
project contains:
the loaded or combined data, with the list of source files and the combination method;
the processing state: background subtraction, RFI cleaning, isolated burst;
the view: display range, thresholds, units, axis scale, color map and graph properties;
annotations, light curves and their settings, and a loaded STEREO/SWAVES panel (restored without downloading it again);
the active processing preset, the operation log and the last time-window synchronization;
the analysis session: maximum-intensity points, the fundamental/harmonic choice, the Analyzer’s fit, density model, fold and , and band-splitting points and fits.
Projects are managed from the File menu:
- Save Project
-
(
Ctrl+S, or the toolbar tool) saves to the current project file, asking for a name the first time. - Save Project As...
-
(
Ctrl+Shift+S) saves to a new file. - Open Project...
-
(
Ctrl+Shift+O) opens a project. A project file can also be dropped onto the main window. - Recent Projects
-
lists the last ten projects opened or saved; Clear Recent Projects empties the list, and an entry whose file is missing is removed with a message.
Before a project is opened, or new data are loaded, you are asked whether to save unsaved changes.
Restored analysis sessions
When a project with an analysis session is opened, the Analysis Summary panel reports that the session has been restored. Processing > Analysis Session > Open Restored Analysis reopens the windows that were open when the project was saved — the Maximum Intensities window, the Burst Analyzer and the Type II Band-splitting window — with their points, fits and settings.
Autosave and recovery
While data are loaded and there are unsaved changes, the application writes a recovery snapshot every three minutes. The ten most recent snapshots are kept. If the application did not close normally, it offers to recover the latest snapshot at the next start. File > Recover Last Session... restores the most recent snapshot at any time.
Exporting figures
File > Export As > Export Figure
(Ctrl+E, or the Export toolbar tool) saves
the main plot as a PNG, PDF, EPS, SVG, TIFF or JPG file. Whatever
renderer and theme are on screen, the exported figure is drawn as a
publication-style (“OriginPro-style”) graph in light mode:
Arial type, a closed black frame with inward major and minor ticks on all four sides, a framed color scale, and time ticks on whole UT minutes;
the current zoom, color map, display range, linear or logarithmic frequency axis, and the titles and font sizes from Graph Properties;
every visible overlay: light curves, annotations, the GOES X-ray overlay, the ruler measurement and the STEREO/SWAVES panel.
The plot on screen keeps its own look. On Windows, if the proposed
folder is not writable (for example inside C:
Program Files), you are asked to choose another folder.
The Maximum Intensities window, the Burst Analyzer, the band-splitting window, the Multi-Station Comparison and the Solar Image Analysis tracking panel export their graphs in the same style.
Exporting FITS files
File > Export As > Export to FIT
(Ctrl+F, or the Export as FITS toolbar
tool) writes the spectrum on show as a new FITS file, for downstream
analysis or machine learning. The processed data are exported if
processing has been applied, and the raw data otherwise; combined
datasets are exported as one file.
Before saving, choose the data type (BITPIX):
Auto (the recommended type is shown), 8
(unsigned byte), 16 (signed int16) or
32 (signed int32). Integer types are offered because
some FITS viewers cannot read 64-bit floating-point data. The exported
file keeps the original header, updated with:
HISTORYrecords naming the application, the plot type, the intensity units and the source file(s);COMBINED,COMBMETH(combination method) andNFILESfor combined data;BUNIT,DATAMINandDATAMAX;
and an AXIS binary-table extension with the
FREQUENCY and TIME columns, as in standard
CALLISTO files (see Appendix B).
Provenance reports and analysis logs
For reproducibility, two structured reports can be exported from File > Export As:
- Export Provenance Report...
-
writes a Markdown (
.md) and a JSON (.json) summary with the sections App, Data Source, Processing, RFI, Annotations, Time Sync and Operation Log. - Export Analysis Log...
-
writes
<name>_analysis_log.csvand<name>_analysis_log.txtwith the Analyzer’s fit parameters and the derived shock quantities.
These reports are suitable for laboratory notebooks, collaboration hand-overs and the preparation of papers.
Project report PDF
File > Generate Project Report... creates a consolidated PDF of the current project or loaded dataset. A progress dialog is shown while the report is built. The report contains the sections listed below; sections without content are omitted.
Data Source and Selected FITS Header;
Processing, and RFI, Annotations, and Light Curves;
Analysis Summary and Type II Results, including the fit equation (with when it is not the file start), the density model, and band-splitting output;
Figures: the raw and background-subtracted spectra, light curves with the spectrum, the maximum-intensity fit, the Type II band-splitting plots, the STEREO/SWAVES split view, and any available GOES X-ray, GOES proton, Dst and Kp context plots;
Full FITS Header Appendix.
Every graph in the report is drawn in the same style as Export Figure, on a white page even in the dark theme.
Batch processing
Processing > Batch Processing > Open Batch Processor opens the Batch FIT Processing dialog (Figure 10.1), which renders every FIT file in a folder as a PNG image with consistent settings.
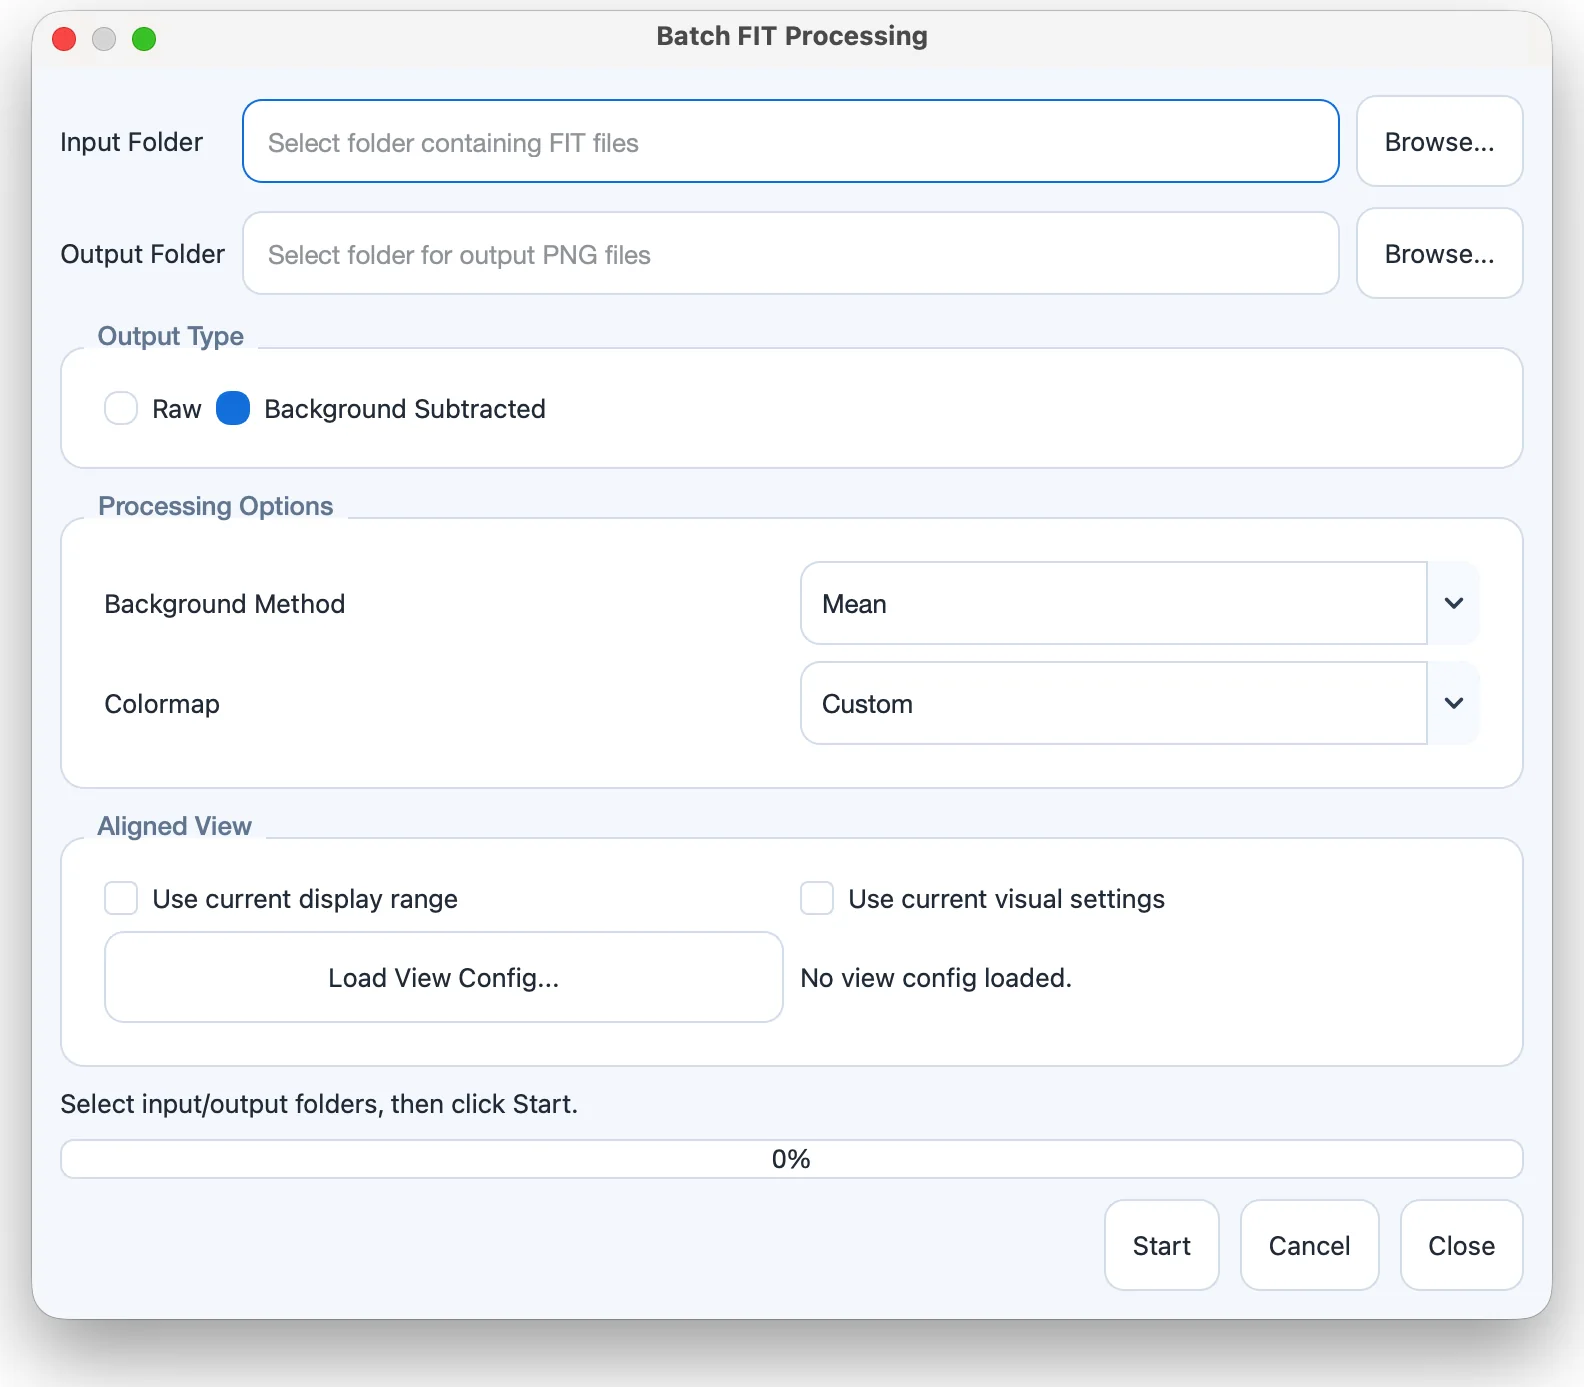
- Input Folder, Output Folder
-
the folder of FIT files to process and the folder for the PNG images (one per input file, at 300 dpi; existing names are not overwritten).
- Output Type
-
Raw or Background Subtracted.
- Processing Options
-
the Background Method (Mean, Median or Plotutil Median (dB)) and the Colormap. Plotutil Median (dB) converts digits to dB with the CALLISTO scale before subtracting the median, and defaults to a display range of to 8 dB.
- Aligned View
-
Use current display range and Use current visual settings apply the main window’s display range and appearance; Load View Config... applies a saved
.efaview.jsonfile instead. These options give many station spectra identical time and frequency axes. - Start, Cancel, Close
-
start the run, cancel it after the current file, or close the dialog. A summary is shown when the run finishes, including any files that failed.