
Before you begin: install the analyzer and have a FITS observation ready, or fetch one with the built-in e-CALLISTO downloader.
Preserve the source
Keep original FITS files with their station and timestamp information. Save a separate project for your analysis so the inputs remain identifiable.
Record the choices
Note the analyzer version, background subtraction, RFI settings, selected range, outlier treatment, and model parameters. Record the exact release version with every result.
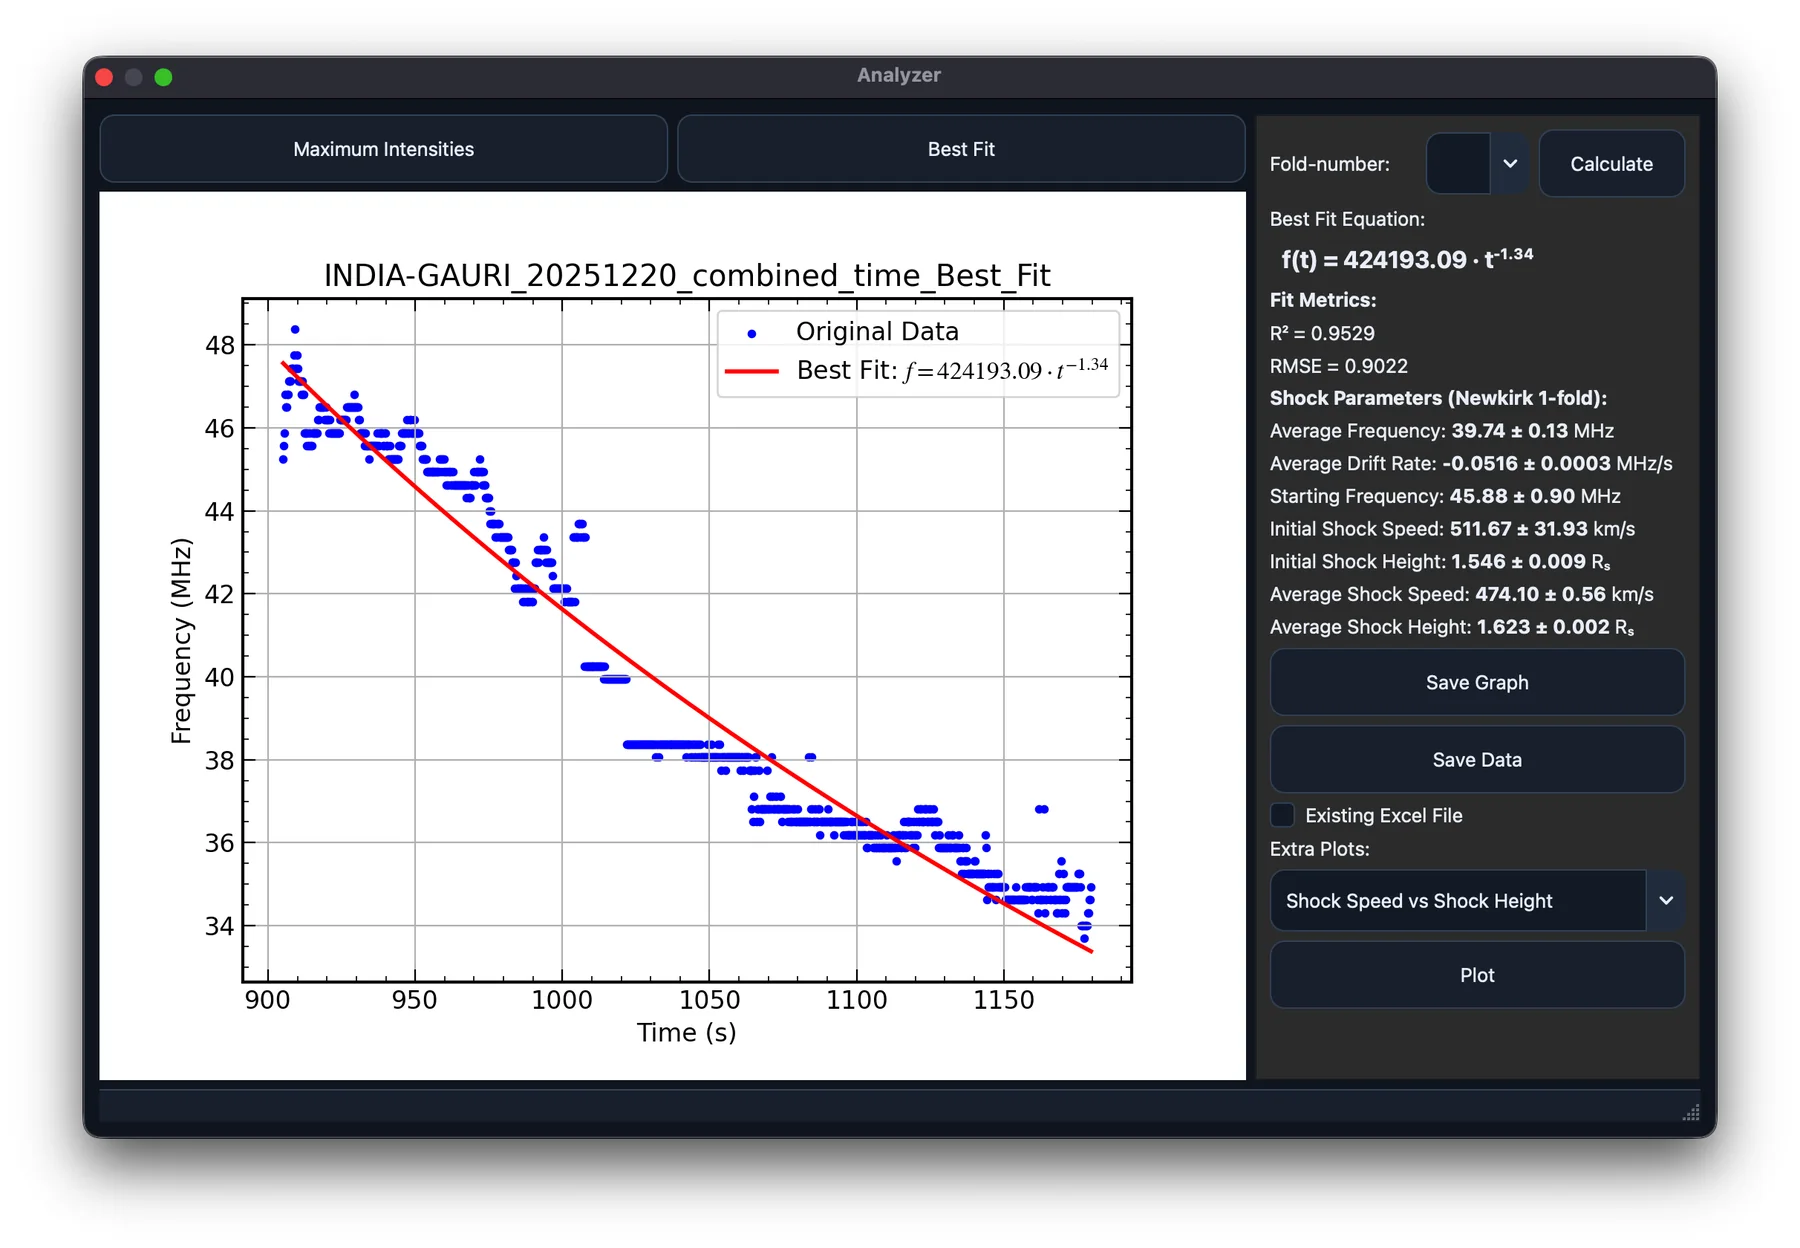
Export the evidence
Save your project as .efaproj. Export processed FITS and the relevant figure or numerical output. Use provenance reports and analysis logs to accompany the result.
Make figures readable
Check axis units, UTC labels, color scale, and selected frequency range. Confirm the exported figure matches the intended analysis view.
Cite and share
Include the software paper and acknowledge the observation source and any additional instrument data. Share a minimal reproducible example when asking for help in GitHub Discussions.
Continue exploring
Consult the user guide for every control and method, or ask about your workflow in GitHub Discussions.